
| ||
|---|---|---|
| PREVIOUS SECTION | CURRENT SECTION | NEXT SECTION |
| 9. Bonding Introduction | 10. Attraction & Repulsion | 11. Combining H+/H/He |
| 10. Graphing Attraction and Repulsion | ||||||||||
|---|---|---|---|---|---|---|---|---|---|---|
|
In Section 2 we found that Coulomb's Law tells us how protons and electrons interact with each other. When we look at combining different atoms or ions to see what happens starting in Section 11, it will be very useful of we can see what happens in a graphical way. | ||||||||||
|
The graphical form that does this is called a potential energy curve. In this chapter, the x axis for this type of plot will always be the separation, r or R, between the two entities that we're trying to combine. The y axis will be the potential energy for those two entities at each value of r in the plot. That means that the y value is a function of the x value. We use the letter U to indicate a potential energy. | ||||||||||
|
The mathematical equation for Coulomb's Law that us tells the potential energy between two charged particles, q1 and q2, is: | ||||||||||
|
U(r) = q1 q2 / r | ||||||||||
|
Back in Section 2, we found that "like charges repel each other." This is the plot both for two protons and for two electrons encountering one another: | ||||||||||
10.1 | 
| |||||||||
|
This is a repulsive potential energy curve. A repulsive curve rises as the separation is decreased from longer to shorter separations. Chemical potential energy curves are very much like the potential energy curves associated with hills and valleys. Going up a repulsive potential is like climbing a hill. It takes effort or work to do that. Also, if you stop, gravity pulls you back down the hill toward where you started. The particular "hill" in Figure 10.1 rises fairly slowly at long separations but then becomes very steep at short separations (for r < 2). | ||||||||||
|
The next potential energy curve we'll look at results from an attractive interaction like a proton encountering an electron, where we found that "unlike charges attract each other": | ||||||||||
10.2 | 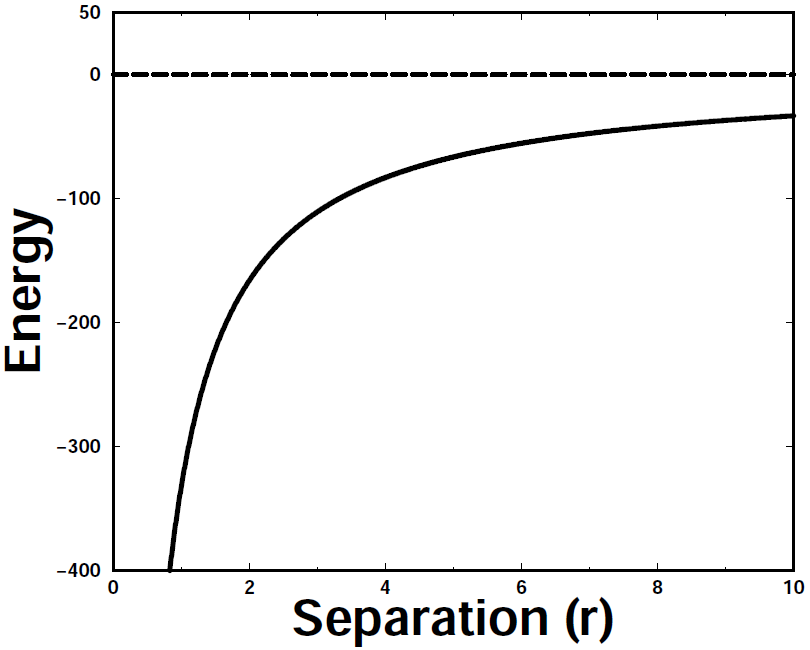
| |||||||||
|
This graph is the mirror image of Figure 10.1. If we encountered a hill like this in the real world and place a ball (or wheeled vehicle) at a point on the right side, it would roll down the hill. That's the nature of an attractive interaction. As with the repulsive potential, the slope is shallow at large r but becomes very steep at shorter r values (for r < 0). | ||||||||||
|
In both of the curves shown in Figures 10-1 and 10-2, the potential energy is heading toward infinity as r approaches zero. We will see repulsive curves like or similar to Figure 10-1 several times in this chapter, but this is the only time we'll see a purely attractive potential energy curve like Figure 10-2. We will, however, see the following curve very often: | ||||||||||
10.3 | 
| |||||||||
|
Like the purely attractive curve in Figure 10-2, this curve is attactive at long separations. The potential energy in all three curves depicted here converges on zero as r becomes larger and larger. But while the curve in Figure 10-3 starts attractive, it turns around and becomes repulsive below a certain value of r (in this case, somewhere around r = 0.70), | ||||||||||
|
The potential energy curve in Figure 10-3 is called a bound potential. What that means is that it's possible for the two entities to be in a stable configuration which corresponds to the separation at the bottom of the well. | ||||||||||
|
The last figure we'll look at in this section is just a modified version of Figure 10-3 that has labels added to it. | ||||||||||
10.4 | 
| |||||||||
|
We've added red and blue dashed lines to the figure. They intersect at the minimum point on the bound potential energy curve. The red dashed line is labeled "rmin" and corresponds to the separation at the minimum point of the curve. Here, rmin = 0.74. The blue dashed line is labeled "ΔEmin" and corresponds to the lowest energy at the minimum. Here, ΔEmin = -109.4. | ||||||||||
|
Potential energy curve are a very useful tool for looking at actual interactions, because they tell us whether a bond can form or not. Let's see if you understand where this is going with a question. | ||||||||||
| ||||||||||
|
The correct answer is (c). A chemical bond can form when a potential energy curve for a given interaction has a stable, bound minimum as shown in Figures 10-3 and 10-4. We will, however, see several cases where an interaction is repulsive, as it is in Figure 10-1. In those cases, no chemical bond forms. | ||||||||||
|
We're now ready to start combining the atoms we built in Chapter 1! We'll start with a small set: H+, H, and He. | ||||||||||
| Click on the link to proceed to the next section: | 11. Combining H+, H, and He |
|---|---|
| MODULE TABLE OF CONTENTS | |

|
| Copyright 2011-2017 University of Illinois. All rights reserved. |
|---|